Six stations
From a question about fairness
to a portfolio engine.
Why we built it, what we chose to compare, where the data came from, and what six years of out-of-sample testing actually returned.
Arrow keys or space to move · P for presenter mode
01
The idea
The maths was never the barrier.
Only about a third of adults worldwide can answer three basic questions about interest, inflation and diversification — and most people who invest do it without the vocabulary to check their own portfolio.
The ones who try hardest often do worst. Barber and Odean tracked 66,000 US households and found the most active traders lost to the market itself: overtrading, overconfidence, and portfolios built from a handful of familiar names. The theory that answers all three was published in 1952 — it just needed clean data, a solver and someone to run it.
02
Choosing the model
Start with Markowitz.
Harry Markowitz laid the foundation for modern portfolio theory, earning the 1990 Nobel Prize in Economic Sciences. His mean–variance framework gave portfolio selection something it rarely had before: a mathematical definition of what “better” means.

03
Comparing methods
We bet on the quantum route. We lost the bet.
The quantum-inspired route is simulated annealing on a QUBO. We ran it against exhaustive enumeration of all 2,598,960 five-name portfolios — not a better heuristic, a proof of which one is best.
Over 12 risk budgets and 12 random seeds there was not a single budget where annealing reached the proven optimum on every seed, and on average it left roughly a quarter of the achievable return on the table. The negative result is the finding, so we report it as the finding.
04
Data & filtering
The boring part decides everything.
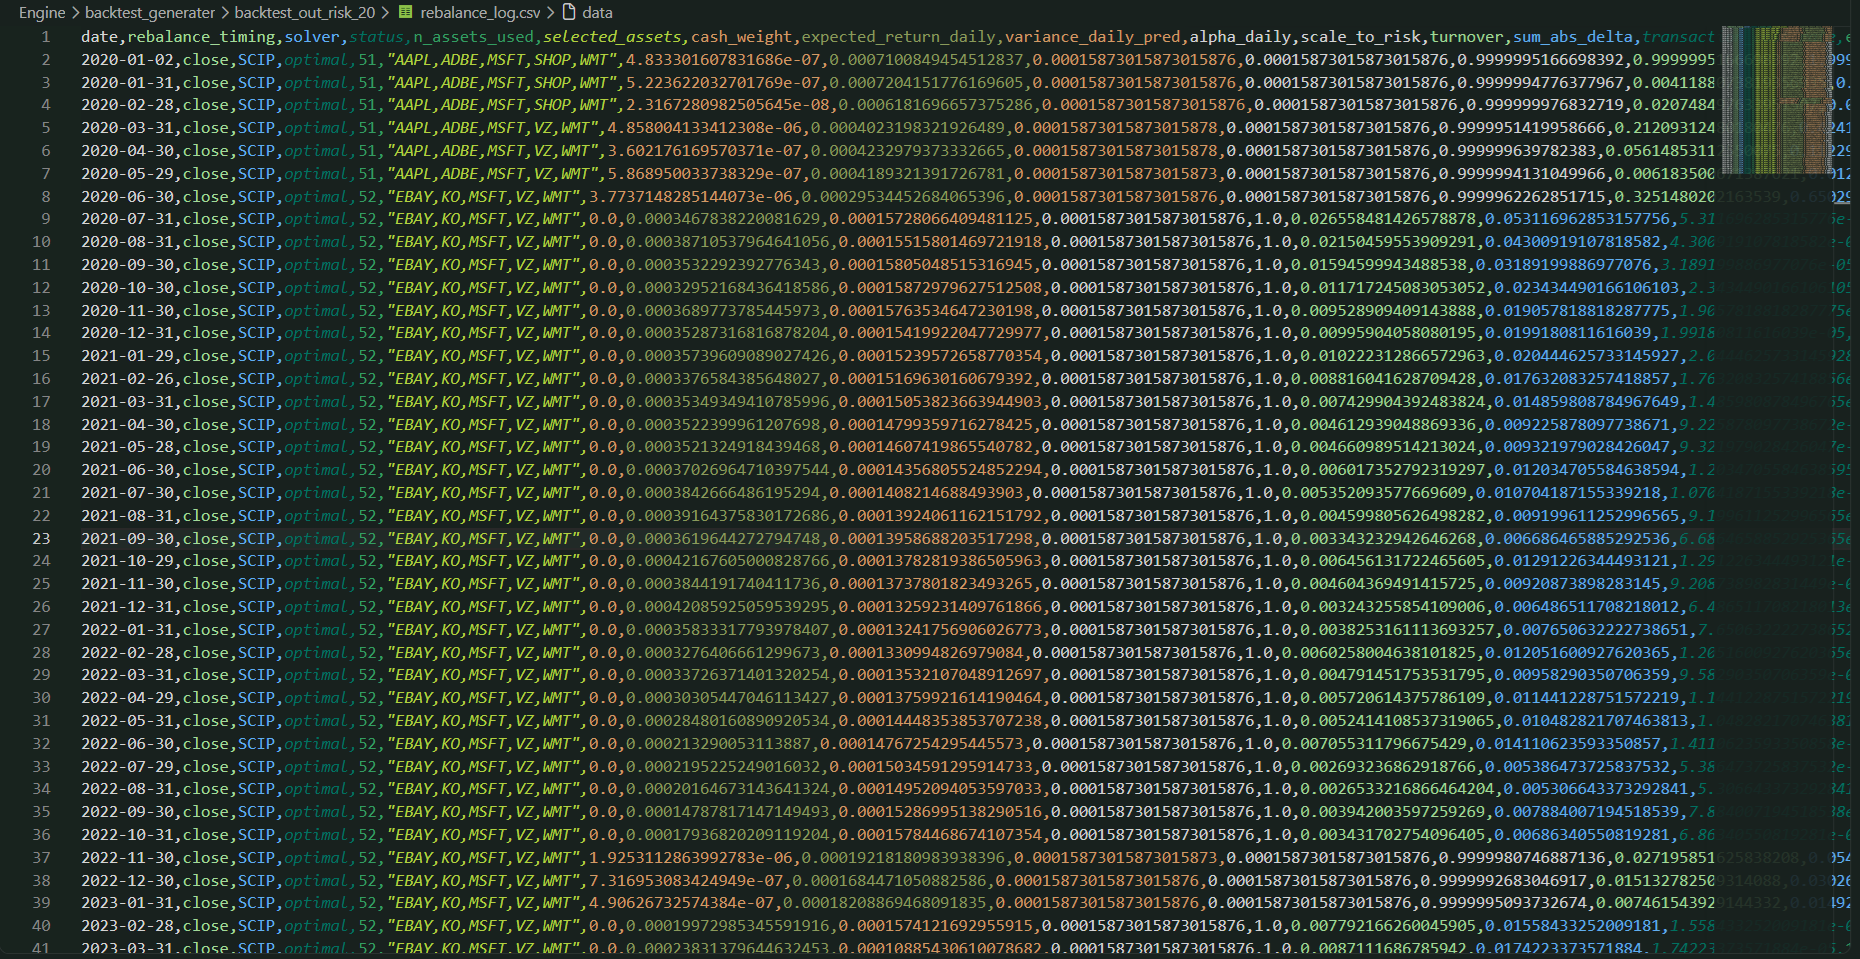
52 US tickers come down from yfinance as raw daily CSVs. Anything carrying fewer than 451 rows of history is dropped outright, and out of what survives we keep only the dates on which every single one of them actually traded.
That is why we asked for 2015 and could honestly only begin in September 2018: 1,836 rows in which nothing is filled in, interpolated or carried forward. Every stage stays a plain CSV on disk — the prices going in, the estimated μ and Σ, and every decision the solver made coming back out. Open any of them and check us.
05
Results
Six years, out-of-sample, costs paid.
Each rebalance sees only the three years behind it, and the decision day is excluded from its own estimate. Weights are set monthly, executed the following day at the close, and every trade pays 10 basis points on the full notional.
Across 1,508 trading days and 73 rebalances, the conservative setting compounded at 16.4% a year against the S&P 500's 14.9%, and its deepest fall was 27.2% against the index's 33.7%. More return out of a shallower hole — while paying costs the index never pays.
06
PEX partnership
The exchange gave us access no student project had before.
Our partnership with the Palestine Exchange gave MarkoScale direct access to its historical market data — and, most importantly, official API access.
We are the first student project ever to receive a PEX API key, with an enterprise-grade API integration that connects MarkoScale directly to the exchange.
The partnership covers 42,370 daily rows across 57 symbols from January 2015 to February 2026, alongside 366 corporate-action events and the official symbol master in Arabic and English.
This infrastructure already powers the PEX Market module. The optimiser is next — we are building toward applying it to PEX-listed assets, not claiming results yet.

Where to go next
Every claim here is checkable.
The documentation carries the full mathematics and the file each formula lives in. The compare page carries the measured results and the command that reproduces them.